SigmaStat v1.0 with ARAI — AI powered Statistical Analysis Scientists Can Stand Behind
Every breakthrough begins with confidence in your data. SigmaStat gives scientists, engineers, researchers, educators, and students a comprehensive statistical environment for transforming complex data into meaningful, defensible conclusions.
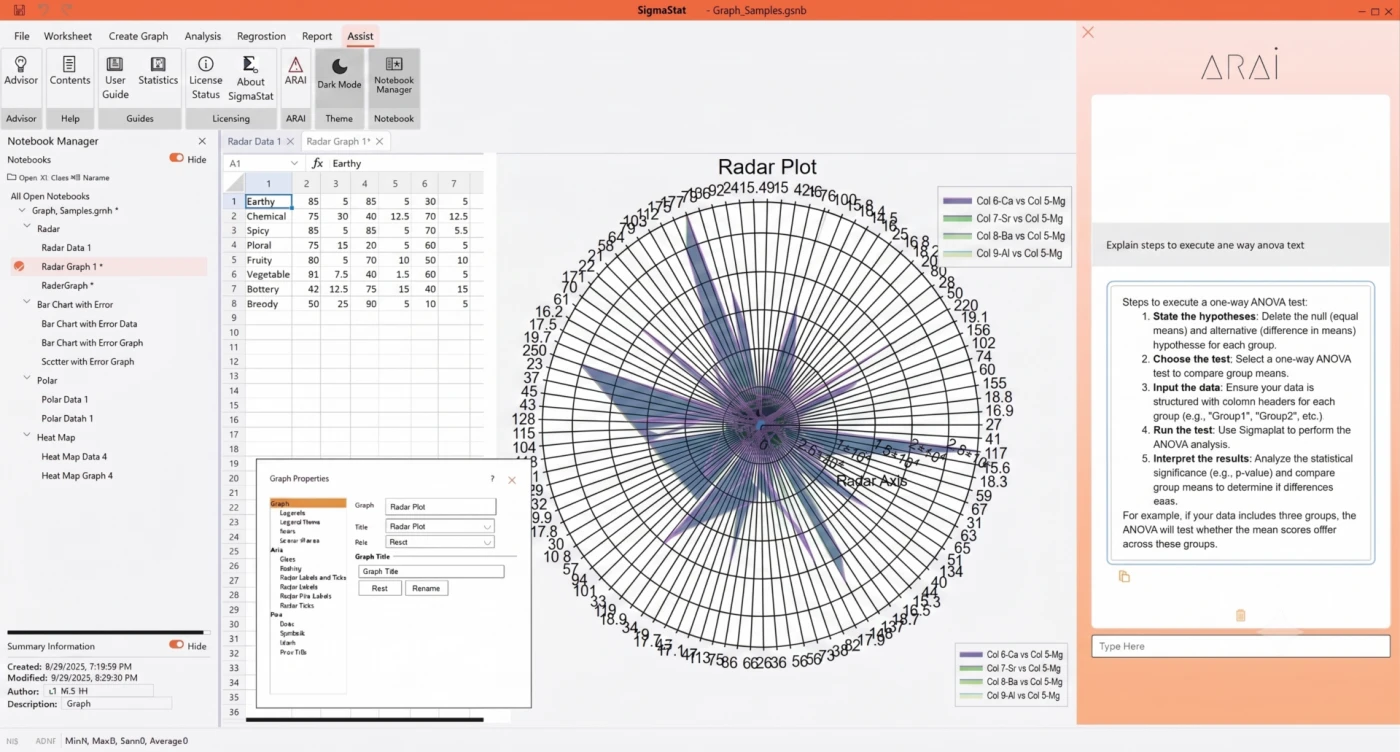
01. Explore
Understand your data
Review distributions, summarize observations, and identify patterns before analysis begins.
02. Choose
Select the right method
Use organized test families, statistical guidance, and ARAI to match the method to the question.
03. Analyze
Run rigorous statistics
Apply proven methods across group comparisons, regression, survival analysis, and more.
04. Interpret
Understand the result
Move from output to insight with clear reports, contextual guidance, and intelligent assistance.
05. Communicate
Share defensible conclusions
Create professional graphs and customizable reports for publication, review, and decision-making.
Built for every stage of scientific research.
SigmaStat combines proven statistical methodology with an intuitive workflow for research, teaching, engineering validation, pharmaceutical development, manufacturing quality, and scientific publishing. Explore distributions, test hypotheses, model relationships, and interpret results without losing sight of the scientific question.
From undergraduate instruction through doctoral research and industrial R&D, SigmaStat scales to the needs of the work while modernizing the experience with cross-platform performance, broader accessibility, and fewer installation barriers.
ARAI — AI-Driven Intelligence and Assistance
ARAI is SigmaStat's private, on-device intelligence layer. It helps users navigate the application, understand statistical concepts, explore the relevance of different methods, and work more confidently—without sending data or questions to external services.
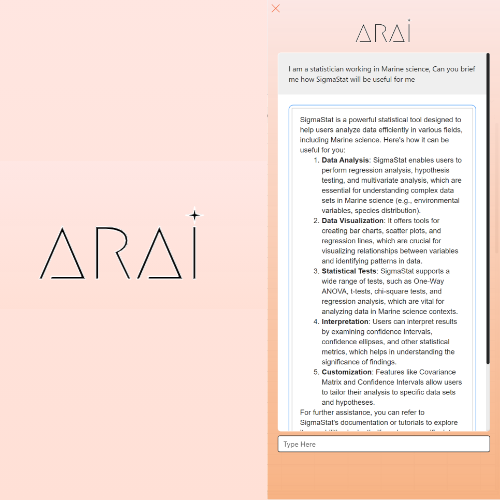
Grounded statistical guidance
A local retrieval system answers questions using SigmaStat help, technical support content, white papers, and curated statistical reference material.
Private, local, and offline
All ARAI functionality runs on your computer. Questions, data, and interactions are never sent to external AI services — with no dependency on an internet connection.
Intelligence across the workflow
Ask conceptual questions, understand when methods are relevant, clarify terminology, and explore analytical approaches without leaving SigmaStat.
A comprehensive statistical toolkit.
What are you trying to learn from your data? SigmaStat organizes a broad collection of statistical methods around the scientific question—helping users describe observations, compare groups, measure relationships, model outcomes, analyze survival, and reduce complexity.
Describe
Describe your data
Build a solid understanding of your data before analyzing it — summarize distributions and spot patterns early.
VALIDATE
Normality testing
Check whether your data meets the assumptions required for parametric methods before you choose a test.
SINGLE GROUP
Analyze a single group
Determine whether a sample differs significantly from a known or hypothesized value.
TWO GROUPS
Compare two groups
Evaluate differences between two independent groups, for normal or non-parametric data.
BEFORE/AFTER
Before-and-after studies
Measure change within the same subjects by comparing paired observations.
MULTIPLE GROUPS
Compare multiple groups
Analyze experiments with multiple groups, including factorial designs and covariance.
REPEATED MEASURES
Repeated measures
Analyze repeated observations from the same subjects while accounting for within-subject variation.
CATEGORICAL
Rates and proportions
Analyze categorical data, proportions, and contingency tables common in biomedical and clinical research.
RELATIONSHIPS
Correlation analysis
Measure the strength and direction of relationships between variables.
PREDICTION
Regression analysis
Model relationships and generate reliable predictions, from linear fits to advanced multivariable techniques.
REPEATED MEASURES
Principal components
Reduce data complexity and identify the variables that contribute most to variation in your dataset.
TIME-TO-EVENT
Survival analysis
Compare survival distributions and model risk over time with dedicated time-to-event tools.
Read More >>